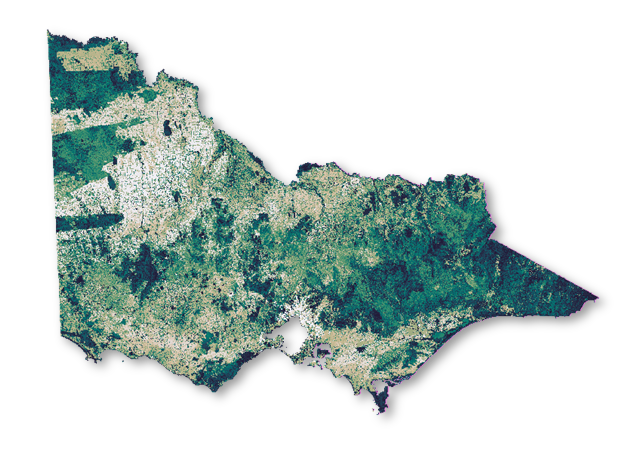
The Habitat Value map combines information on thousands of species habitats to show the relative biodiversity value of landscapes in Victoria.

Habitat Value ranks the value of biodiversity by considering the number of species for which a location provides habitat and their rarity in a statewide context to enable a comparison of all locations across Victoria. This map can be used to help prioritise areas for protection or to help avoid areas of high biodiversity value in development footprints. Locations ranked as higher Habitat Value can be considered as more irreplaceable in comparison to lower ranked locations and include both unique assemblages of species, including threatened species, as well as the last remaining habitat in the state for particular threatened species.
Habitat Value does not highlight areas that are “no-go” zones for development. Instead, the map can be used to consider the relative value of biodiversity to help design programs that minimise impacts.
Download the Habitat Value factsheet to learn more
Habitat Value Factsheet (PDF, 288.0 KB)
Habitat Value Factsheet (accessible version) (DOCX, 1018.6 KB)
In the map above, highly ranked places are the darkest blue areas, while the lowest ranked places are beige. See below for a note on the colour scheme applied to this map.
Accessing Habitat Value
Habitat Value can be explored within DEECA’s NatureKit web mapping application.
Alternatively, the spatial dataset is available to download from DataShare. Habitat Value is a raster dataset distributed as a GEOTIFF.
Key points for users
When viewing the Habitat Value map, users should be mindful of:
- The Habitat Distribution Models used to build Habitat Value predict suitable habitat for a species, but there are instances where a species is not currently present in that habitat.
- Recent changes on the ground will not immediately be reflected on the map. This may include recent land cover changes, including from native vegetation removal, severe bushfires or timber harvesting.
In most instances, further assessment will be required to understand the specific drivers of lower or higher ranked values in a particular place.
A New Name and Improvements
Habitat Value is an update of the Strategic Biodiversity Values (SBV) v4 dataset from 2016. Habitat Value improves on SBV by:
- Improving the spatial resolution from 225m pixels to 75m pixels
- Including all species where habitat models are available, rather than just threatened species
- Including the latest Land Cover Time Series epoch to define native vs non-native land cover types
Continuous improvement
We are committed to a continuous improvement approach, which enables products and tools to be updated as further data, computational power, research, and modelling methods become available.
Everyone can contribute to the improvement of these datasets, maps, and tools. For example, by submitting species records to the Victorian Biodiversity Atlas. VBA records are a key source of information for Habitat Distribution Models, and therefore Habitat Value and other datasets and decision-support tools. Visit the Victorian Biodiversity Atlas web page for more information.
Habitat Value – Frequently Asked Questions
Habitat Value is a single map showing the value of biodiversity, relative to all other places across Victoria.
A location becomes more highly ranked when it is habitat for many species, or for a rare or threatened species.
The complexity of biodiversity is difficult to represent in a single map. Habitat Value uses sophisticated modelling techniques to attempt to capture the dynamic and complex interactions occurring within and across species.
Models are a central component of modern science that help us make sense of complex calculations and datasets.
Spatial mapping of environmental data always requires some form of extrapolation. Usually this is done by mathematical modelling where the logic and method are clear and easily repeatable, and any comparisons across values (e.g. species habitats) can be consistently made.
All spatial models have some limitations and inaccuracies. Good modelling practice allows insights into the limitations of inputs and outputs, to enable users to be aware of how reliable the mapping is.
Habitat Distribution Models are developed from species sightings and observation data reported to the Victorian Biodiversity Atlas.
A location modelled as habitat for a species does not mean the species is present at that location. There may be a range of factors, including competition and threats from introduced species, that may impact on a species’ occupancy at a location even where the habitat is modelled as suitable.
Habitat Value can be used to help strategically avoid areas of high biodiversity value when planning development footprints. A single statewide map will allow users to identify and consider high value areas of biodiversity as part of their initial planning.
It is intended to be used early on in projects, potentially reducing the overall impact on biodiversity as well as the requirement for mitigation activities once a project is further developed.
Additional information would need to be considered alongside Habitat Value to determine the risk to biodiversity from a particular development. This would include on-ground environmental impact assessments in line with federal and state legislation.
No thresholds have been applied to Habitat Value to highlight the “high value” places, i.e. this is not intended to be a “go/no-go” map for development.
Instead, the map represents the relative value of a location compared to others and should be used as a broad guide to determine locations that may have less biodiversity value than others. What is considered “high value” biodiversity in an area of interest will depend on the context of the broader landscape.
Continuous raster datasets like Habitat Value are usually displayed in web maps and GIS software as a graduated colour ramp, with colours assigned to the numeric pixel values within the data. Many different types of colour display can be applied to Habitat Value. These colours are not fixed, and simply visualise the range between low biodiversity values (starting at 0) and high biodiversity values (ending at 100). In the map above, the colour ramp “Rain” has been chosen to highlight the differences between high and low values.
Page last updated: 31/10/24